Topics
-
Linear Regression
-
Correlation
-
Residuals
-
Outlier
-
Data
Description
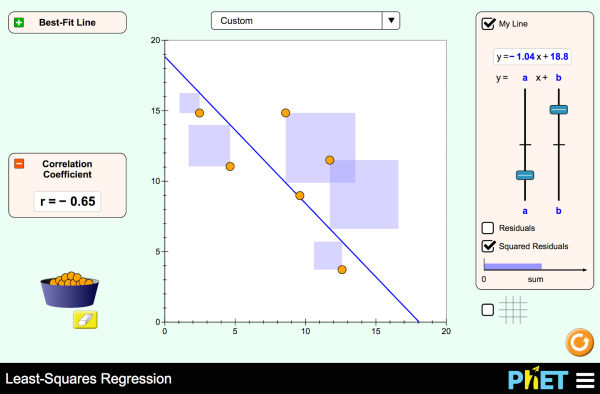
Create your own scatter plot or use real-world data and try to fit a line to it! Explore how individual data points affect the correlation coefficient and best-fit line.
Sample Learning Goals
- Interpret r (the correlation coefficient) as data points are added, moved, or removed.
- Interpret the sum of the squared residuals while manually fitting a line.
- Interpret the sum of the squared residuals of a best-fit line as a data point is added, moved, or removed.
- Compare the sum of the squared residuals between a manually fitted line and the best-fit line.
- Determine if a linear fit is appropriate.
Standards Alignment
Common Core - Math
8.SP.A.1
Construct and interpret scatter plots for bivariate measurement data to investigate patterns of association between two quantities. Describe patterns such as clustering, outliers, positive or negative association, linear association, and nonlinear association.
8.SP.A.2
Know that straight lines are widely used to model relationships between two quantitative variables. For scatter plots that suggest a linear association, informally fit a straight line, and informally assess the model fit by judging the closeness of the data points to the line.
8.SP.A.3
Use the equation of a linear model to solve problems in the context of bivariate measurement data, interpreting the slope and intercept. For example, in a linear model for a biology experiment, interpret a slope of 1.5 cm/hr as meaning that an additional hour of sunlight each day is associated with an additional 1.5 cm in mature plant height.
HSS-ID.B.6
Represent data on two quantitative variables on a scatter plot, and describe how the variables are related.
HSS-ID.B.6a
Fit a function to the data; use functions fitted to data to solve problems in the context of the data. Use given functions or choose a function suggested by the context. Emphasize linear, quadratic, and exponential models.
HSS-ID.B.6b
Informally assess the fit of a function by plotting and analyzing residuals.
HSS-ID.B.6c
Fit a linear function for a scatter plot that suggests a linear association.
HSS-ID.C.8
Compute (using technology) and interpret the correlation coefficient of a linear fit.
Version 1.1.20
HTML5 sims can run on iPads and Chromebooks, as well as PC, Mac, and Linux systems.
iPad:
iOS 12+ Safari
iPad compatible sims
Android:
Not officially supported. If you are using the HTML5 sims on Android, we recommend using the latest version of Google Chrome.
Chromebook:
Latest version of Google Chrome
The HTML5 and Flash PhET sims are supported on all Chromebooks.
Chromebook compatible sims
Windows Systems:
Microsoft Edge, latest version of Firefox, latest version of Google Chrome.
Macintosh Systems:
macOS 10.9.5+, Safari 9+, latest version of Chrome.
Linux Systems:
Not officially supported. Please contact phethelp@colorado.edu with troubleshooting issues.


