Topics
-
Graphing Linear Equations
-
Lines
-
Slope
Description
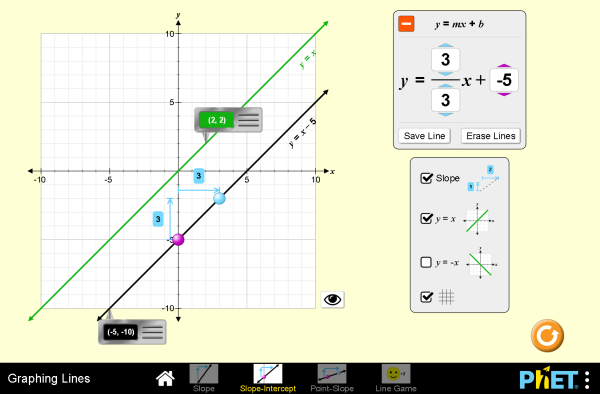
Explore the world of lines. Investigate the relationships between linear equations, slope, and graphs of lines. Challenge yourself in the line game!
Sample Learning Goals
- Explain how the slope of a graphed line can be computed.
- Graph a line given an equation in either slope-intercept or point-slope form.
- Write an equation in slope-intercept or point-slope form given a graphed line.
- Predict how changing variables in a linear equation will affect the graphed line.
Standards Alignment
Common Core - Math
8.EE.B.5
Graph proportional relationships, interpreting the unit rate as the slope of the graph. Compare two different proportional relationships represented in different ways. For example, compare a distance-time graph to a distance-time equation to determine which of two moving objects has greater speed.
8.EE.B.6
Use similar triangles to explain why the slope m is the same between any two distinct points on a non-vertical line in the coordinate plane; derive the equation y = mx for a line through the origin and the equation y = mx + b for a line intercepting the vertical axis at b.
8.EE.C.8a
Understand that solutions to a system of two linear equations in two variables correspond to points of intersection of their graphs, because points of intersection satisfy both equations simultaneously.
8.EE.C.8b
Solve systems of two linear equations in two variables algebraically, and estimate solutions by graphing the equations. Solve simple cases by inspection. For example, 3x + 2y = 5 and 3x + 2y = 6 have no solution because 3x + 2y cannot simultaneously be 5 and 6.
8.F.A.3
Interpret the equation y = mx + b as defining a linear function, whose graph is a straight line; give examples of functions that are not linear. For example, the function A = s2 giving the area of a square as a function of its side length is not linear because its graph contains the points (1,1), (2,4) and (3,9), which are not on a straight line.
HSF-IF.C.7
Graph functions expressed symbolically and show key features of the graph, by hand in simple cases and using technology for more complicated cases.*
HSF-IF.C.7a
Graph linear and quadratic functions and show intercepts, maxima, and minima.
HSF-LE.A.1a
Prove that linear functions grow by equal differences over equal intervals, and that exponential functions grow by equal factors over equal intervals.
Version 1.3.10
HTML5 sims can run on iPads and Chromebooks, as well as PC, Mac, and Linux systems.
iPad:
iOS 12+ Safari
iPad compatible sims
Android:
Not officially supported. If you are using the HTML5 sims on Android, we recommend using the latest version of Google Chrome.
Chromebook:
Latest version of Google Chrome
The HTML5 and Flash PhET sims are supported on all Chromebooks.
Chromebook compatible sims
Windows Systems:
Microsoft Edge, latest version of Firefox, latest version of Google Chrome.
Macintosh Systems:
macOS 10.9.5+, Safari 9+, latest version of Chrome.
Linux Systems:
Not officially supported. Please contact phethelp@colorado.edu with troubleshooting issues.


