Topics
- Thermodynamics
- Temperature
- Heat
- Gas
- Reaction
- Thermal Energy
Description
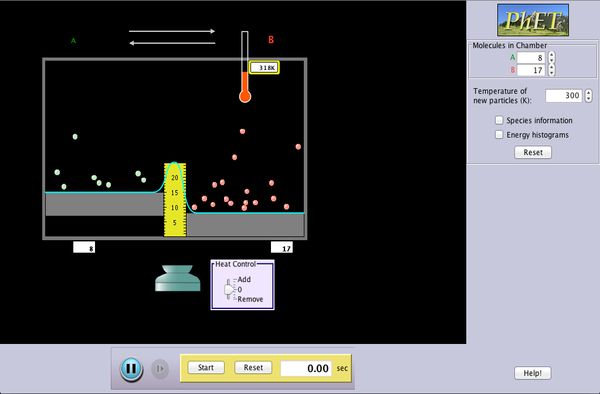
Watch a reaction proceed over time. How does total energy affect a reaction rate? Vary temperature, barrier height, and potential energies. Record concentrations and time in order to extract rate coefficients. Do temperature dependent studies to extract Arrhenius parameters. This simulation is best used with teacher guidance because it presents an analogy of chemical reactions.
Sample Learning Goals
- Describe on a microscopic level, with illustrations, how reactions occur.
- Describe how the motion of reactant molecules (speed and direction) contributes to a reaction happening.
- Predict how changes in temperature, or use of a catalyst will affect the rate of a reaction.
- On the potential energy curve, identify the activation energy for forward and reverse reactions and the energy change between reactants and products.
- Sketch how the concentrations of reactants and products change as a reaction proceeds.
- From a graph of concentration as a function of time, students should be able to identify when a system has reached equilibrium.
- Calculate a rate coefficient from concentration and time data.
- Determine how a rate coefficient changes with temperature.
- Compare graphs of concentration versus time to determine which represents the fastest or slowest rate.
Version 3.15


